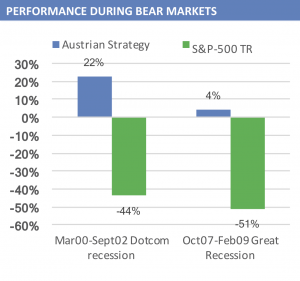
The main added value of the Austrian Strategy is generating equity-like returns over the medium-long term, but with much less volatility and substantially smaller drawdowns.
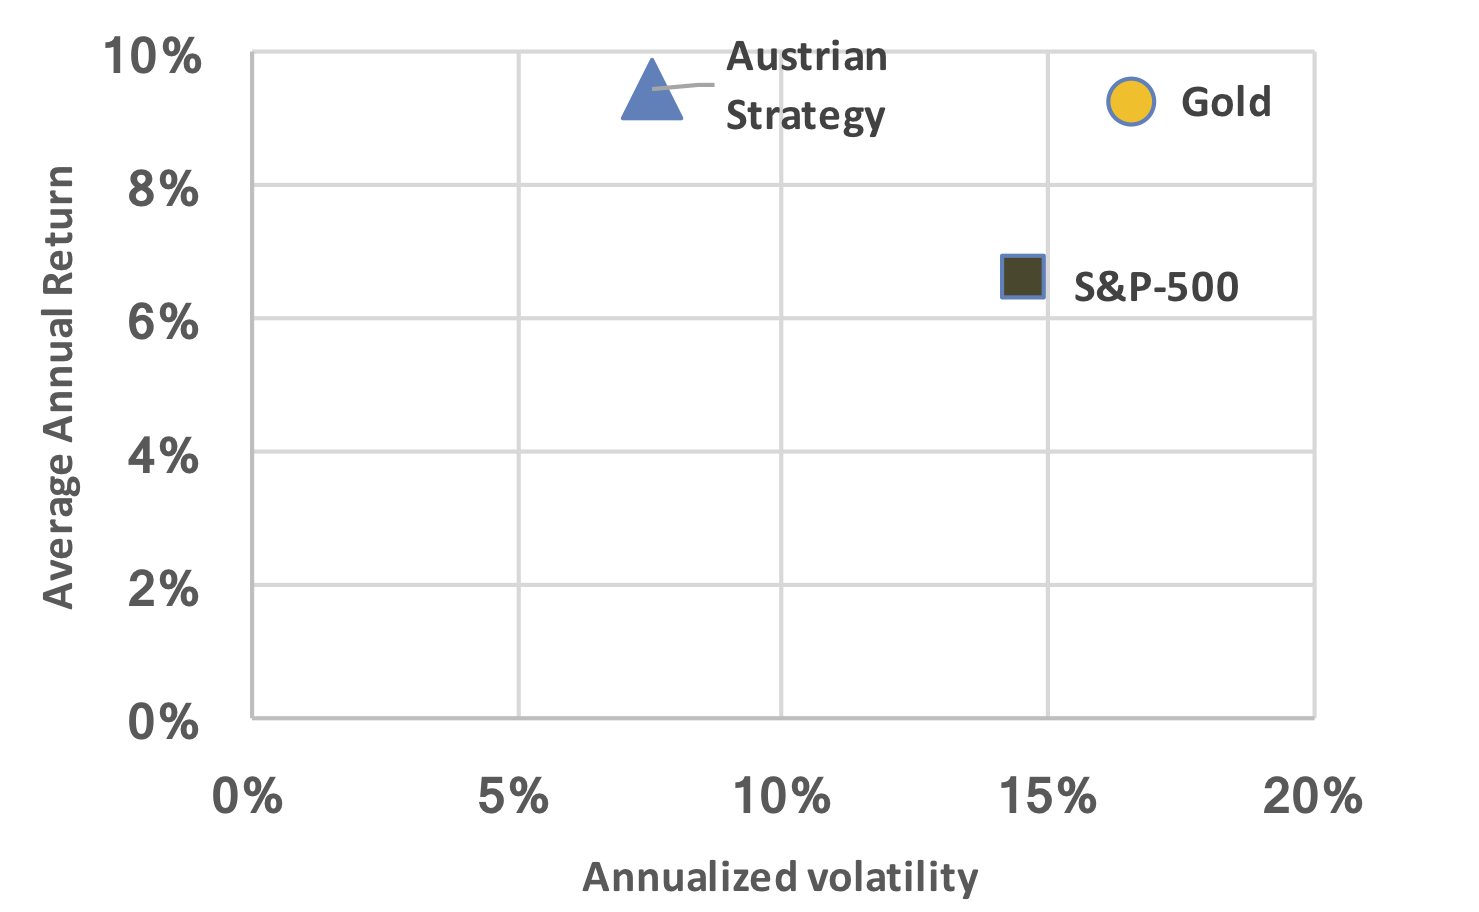
| 2000 – 2019 | Gold | S&P-500 TR | Austrian Strategy TR |
| Annual Average Return: | 9.25% | 6.57% | 9.64% |
| Volatility: | 16.59% | 14.57% | 7.55% |
| Worst Drawdown: | -42.44% | -50.89% | -9.31% |
Annual Gross Returns of the Austrian Strategy compared with Gold and S&P-500 TR, from 2000 until August 2019:
| Year | Gold | S&P-500 TR | Austrian Strategy TR |
| 2000 | -6.06% | -9.09% | 7.38% |
| 2001 | 1.41% | -11.88% | 8.74% |
| 2002 | 23.96% | -22.10% | 10.30% |
| 2003 | 21.74% | 28.69% | 27.46% |
| 2004 | 4.40% | 10.76% | 16.45% |
| 2005 | 17.77% | 4.79% | 13.10% |
| 2006 | 23.54% | 15.70% | 23.00% |
| 2007 | 31.58% | 5.39% | 10.52% |
| 2008 | 2.99% | -36.98% | 6.68% |
| 2009 | 27.13% | 26.45% | 7.39% |
| 2010 | 27.24% | 14.94% | 18.55% |
| 2011 | 11.21% | 2.06% | 9.63% |
| 2012 | 5.26% | 15.85% | 8.88% |
| 2013 | -28.09% | 32.23% | 1.11% |
| 2014 | -0.58% | 13.54% | 9.82% |
| 2015 | -11.78% | 1.37% | -1.36% |
| 2016 | 8.69% | 11.81% | 4.72% |
| 2017 | 11.41% | 21.70% | 7.99% |
| 2018 | -1.54% | -4.43% | -4.75% |
| 2019 until August | 18.57% | 17.61% | 11.24% |
Growth of $100 invested in Dec-1999 until Aug-2019 (Log scale)
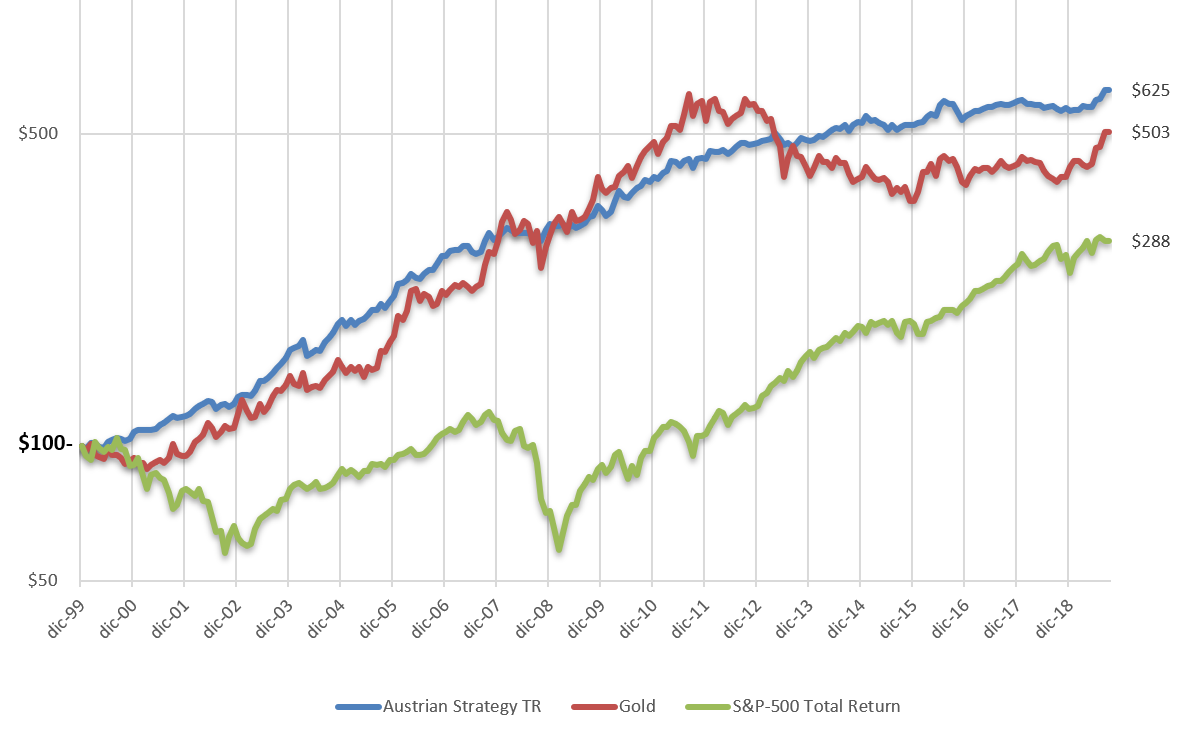
Notice that the Austrian Strategy does not try to achieve a higher return than the classic assets —which will be unsustainable in the long term—, but it provides a similar return with less risk. In the chart above you can see how the strategy successfully navigates the bear markets in gold during 2012-15 as well as in the stock markets during 2000-02 and 2008.
Monthly Gross Total Returns since January 2008

This equity-like returns with less risk make a huge psychological difference, as it is easy to follow a strategy with low volatility and lower drawdowns, compared to always remaining invested in all assets (which usually suffer drawdowns of 50% or greater from time to time).
Reducing risk adds value compared to an always invested portfolio by:
- Mitigating outsized losses:
- Worst month: -4.67%, September 2011.
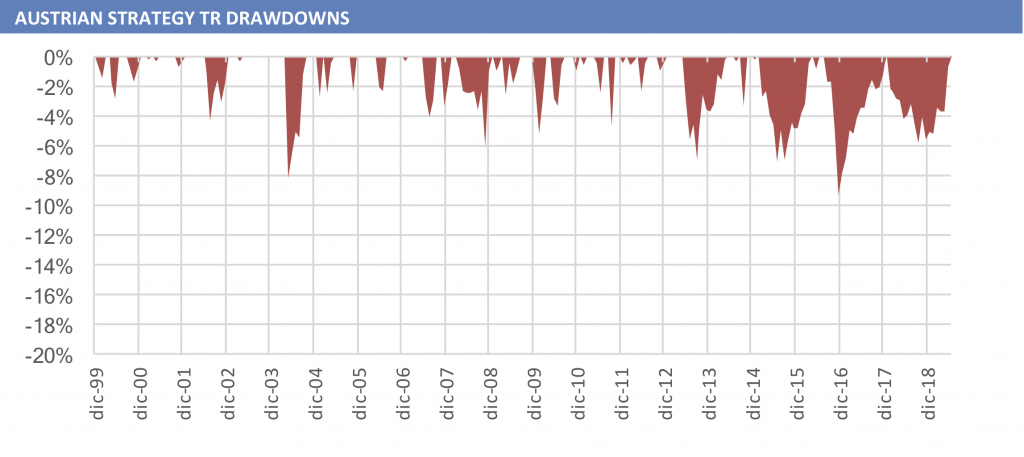
- Reducing drawdowns:
- From -51% in the S&P-500 to -9.31%.
- Reducing volatility:
- From 14.59% in the S&P-500% to 7.51%.
- Shortening recovery time:
- From 6+ years in the S&P-500 to 1.5 years.
- Allowing an easy-to-follow strategy and more efficient compounding over time.
Preservation of wealth being paramount —especially during the inevitable and cyclical crises and recessions—, the Austrian Strategy aims to generate steady capital growth across all economic environments.
Based on simplicity and intellectual humility, it is a convenient and solid core for investors’ portfolio in a complex and unpredictable world.
→ You can always subscribe to the Austrian Investor Newsletter here.